What are we talking about ?
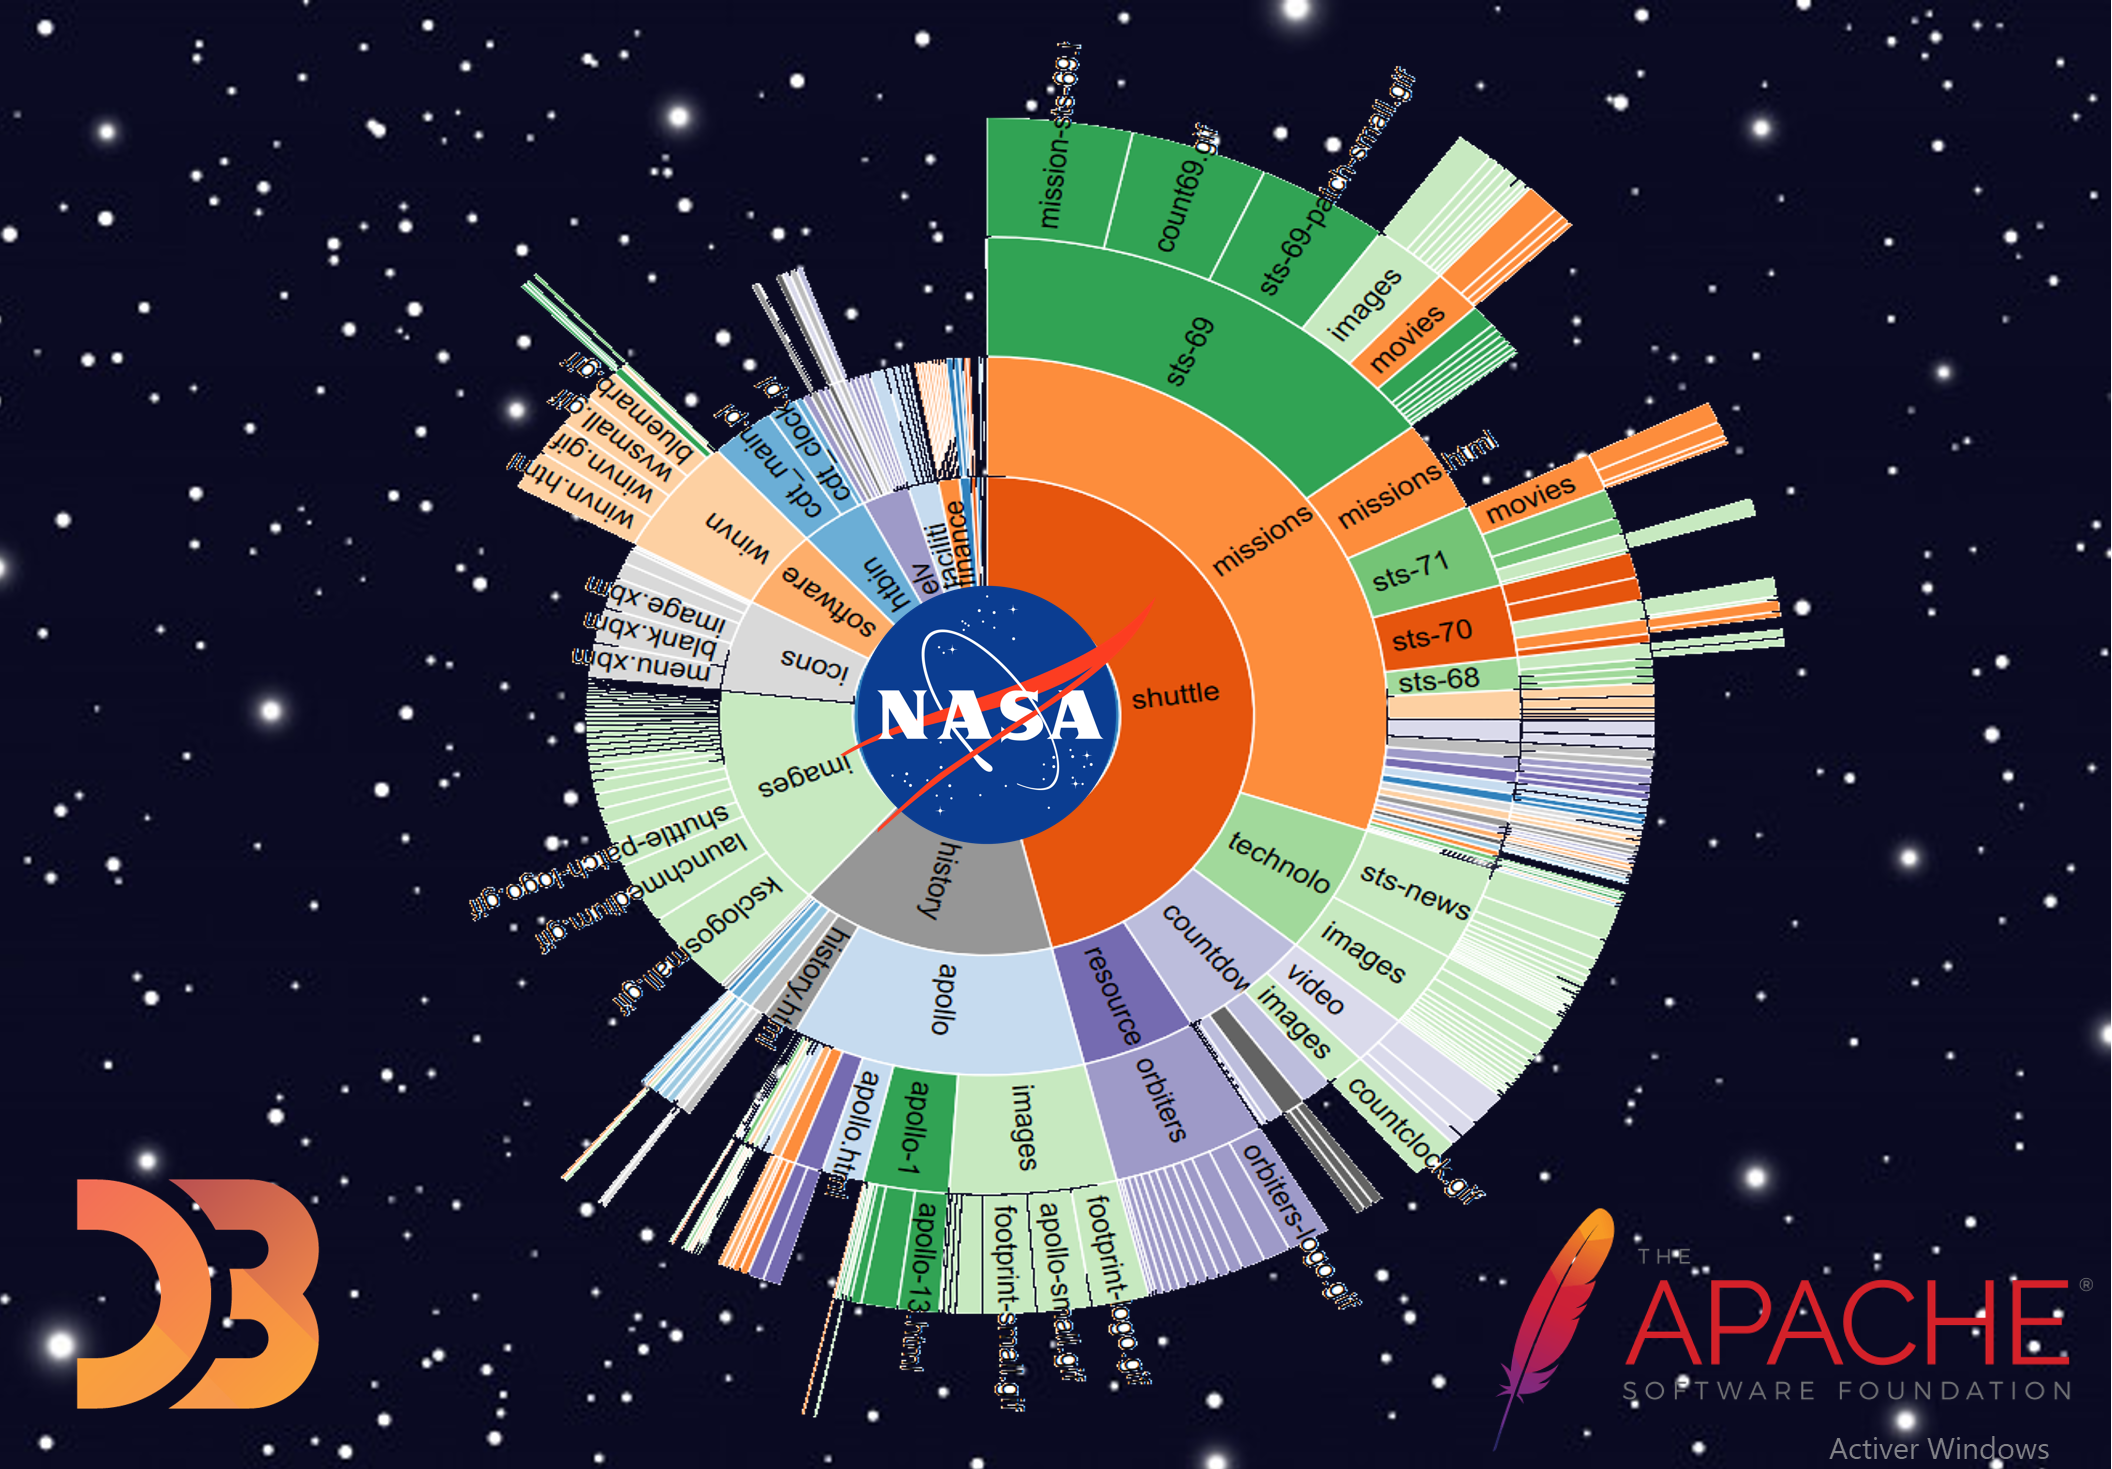
When websites were still in their infancy, we were able to reconstruct how early Internet users navigated one of the first versions of NASA’s website intended for the general public.
It is from the Apache access log of July and August dating from 1995, that it was possible to reconstruct the navigation of Internet users represented in the form of a ray of sunshine. This denotes the preferences and trends of current Internet users and the distribution of views according to the pages available.
As all the representations, there are a number of limitations to this representation. First of all the page reloads several times which artificially increase the statistics of this page. Other limits, a user who arrives directly on a page or through this representation which hides important information such as bounce rates.
Despite all these shortcomings, it provides a general representation to see the main habits of Internet users.
Explore the NASA sunburst by clicking here
NASA access log data is available here, for GDPR reasons it has been anonymized:
Application on your own website
Most websites still use Apache-type Logs to store connection history. It is possible to create your own Sunburst to see the activity of your website on the net.
You must first retrieve the Access logs of your website, generally you will find them in the following location of your server: /var/log/apache2/access.log.
- Example of Accesslog:
XXX.XXX.XXX.XXX – – [01/Aug/1995:00:04:53 -0400] “GET /history/apollo/apollo-13/apollo-13.html HTTP/1.0” 200 18556
Generally we have access to the following information for each log line:
- source ip address
- Customer Identity. Returns a dash (-) if the information is not available.
- Date timestamp of the request.
- Addresses the request with the http method (ex: POST) and the protocol (ex: HTTP/1.3).
- Return status code of the request. (ex: 404, 500 etc.)
- size of the requested resource.
It is also possible to customize these logs to your liking
• Data transformation
It is then necessary to transform the raw data of the Access log into readable data by sunburst, for this I offer you this python script. It will take as input the Access log file and return the data in the form of a json file. This script cleans the data by keeping only the requests that have succeeded “code 200” and also aggregates the number of views of each page and indicates this information in the json.
import re
import pandas as pd
from datetime import datetime
import json
from collections import defaultdict


def acces_log_to_dataFrame(path_to_acces_log,status = all, day = all):

    df = pd.read_csv(path_to_acces_log,
                  sep=r'\s(?=(?:[^"]*"[^"]*")*[^"]*$)(?![^\[]*\])',
                  engine='python',
                  usecols=[0,3,4,5,6],
                  names=['ip','date','req','status','size'],
                  na_values='-',
                  header=None,
                    )

    #clean & cast int
    df = df[pd.to_numeric(df['status'], errors='coerce').notnull()]
    df = df[pd.to_numeric(df['size'], errors='coerce').notnull()]
    df["status"] = df.status.astype("int")
    df["size"] = df.size.astype("int")

    #create separated columns
    df["protocol"] = df.req.astype("str").apply(lambda s: s.split()[0] if len(s.split())>2 else None) #protocol
    df["request"] = df.req.astype("str").apply(lambda s: s.split()[1] if len(s.split())>2 else None) #request
    df["version"] = df.req.astype("str").apply(lambda s: s.split()[2] if len(s.split())>2 else None) #version
    df["datetime"] = df.date.astype("str").apply(lambda s: datetime.strptime(s[1:-1], '%d/%b/%Y:%H:%M:%S %z') if len(s)> 10 else None)

    df.drop(['req','date'], inplace=True, axis=1)

    #filter
    df = df if status == all else df[df.status.isin(status)]
    df = df if day == all else df[df.datetime.dt.day_name() == day]

    return df
- D3.js Sunburst
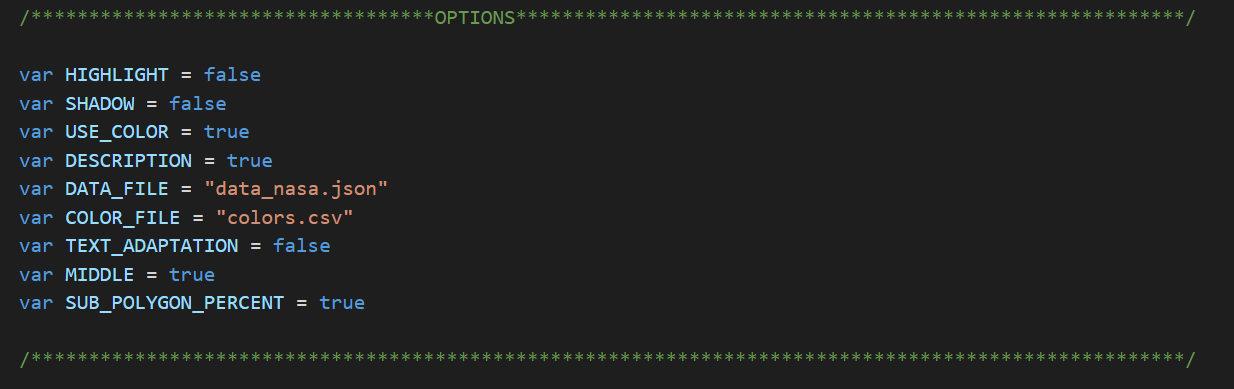
Using Sunburst is relatively simple, the index.htm page allows you to customize and specify the input files used. You will also have access to certain aesthetic options, which will allow you, for example, to change the color of a cell (colors chosen automatically otherwise).
If you launch your sunburst locally, you will also need to make sure you have launched a small server as explained here , or use Firefox, to run D3.js locally.
All scripts and code for the UI are available on github here, You will find the complete example using NASA data, and applicable to your own data