Bubble chart with D3.js
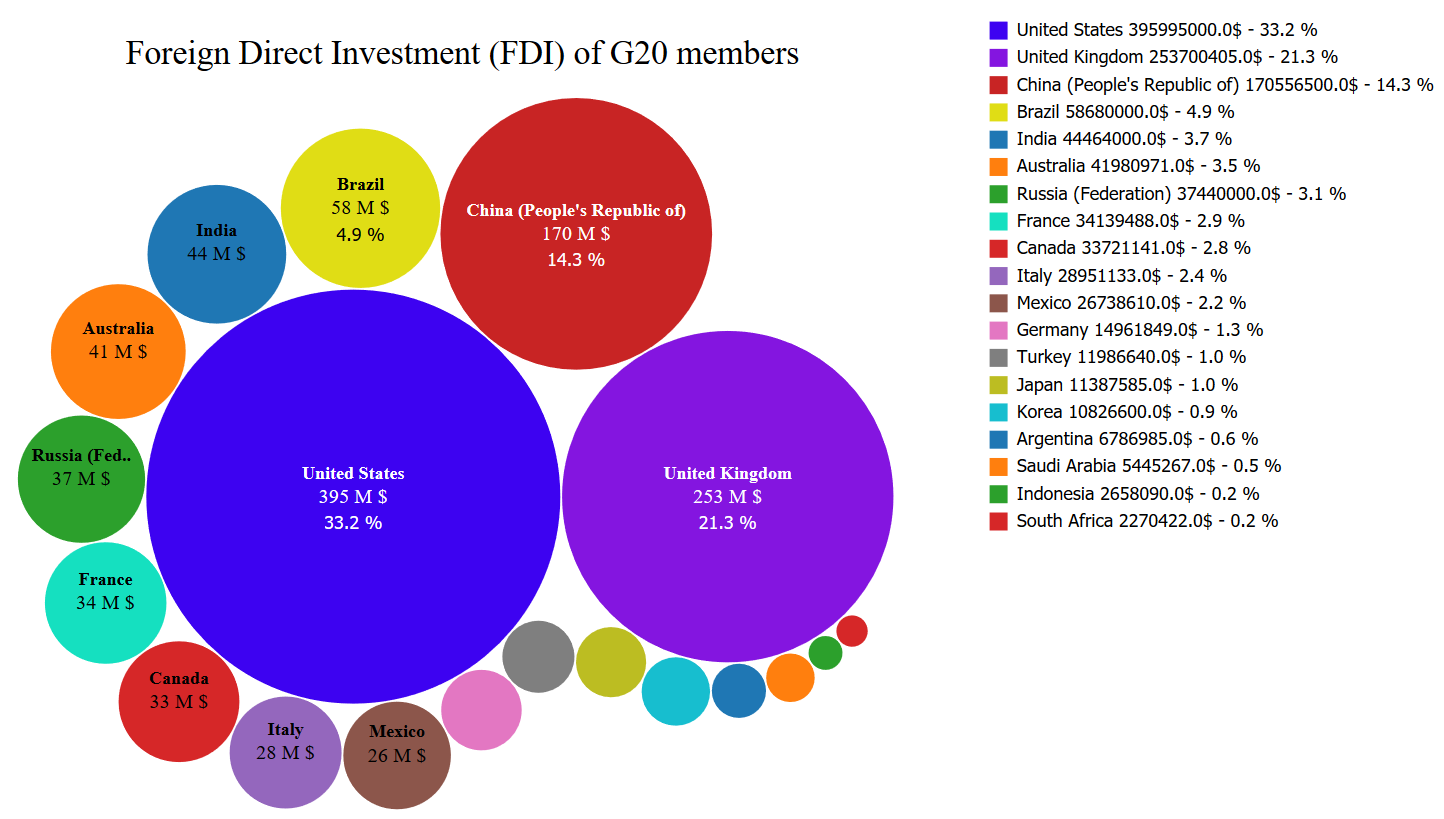
Version française “Bubble”-plot is a different way to present your data, this kind of plotting broaden the possibilities of representation beyond the classics histograms and pie charts. The program is based in a open-source script which has been modified to be able to add other features, for example values in percentage ,the feature’s … [Read more…]