Machine-learning algorithms are often criticized for the opacity that surrounds them. It is difficult to understand how predictions are evaluated.
The way in which supervised algorithms work, no matter how complex, is known. But it remains difficult to understand how one observation is predicted in one class rather than another. The inaccessibility of the characteristics and reasoning that led to a prediction is commonly called the “black box effect”. Most of the supervised algorithms are like that and can in a number of areas be problematic.
The decision trees make it possible to avoid this kind of difficulty because it is indeed quite simple to browse the tree, and to progressively examine the intermediate results. A series of simple mathematical operations lead us progressively to the results of the prediction.
The different benchmarks highlight an interesting performance / computation time ratio. Decision trees are a set of algorithms, there are several variants of which the best known are: CART and C4.5.
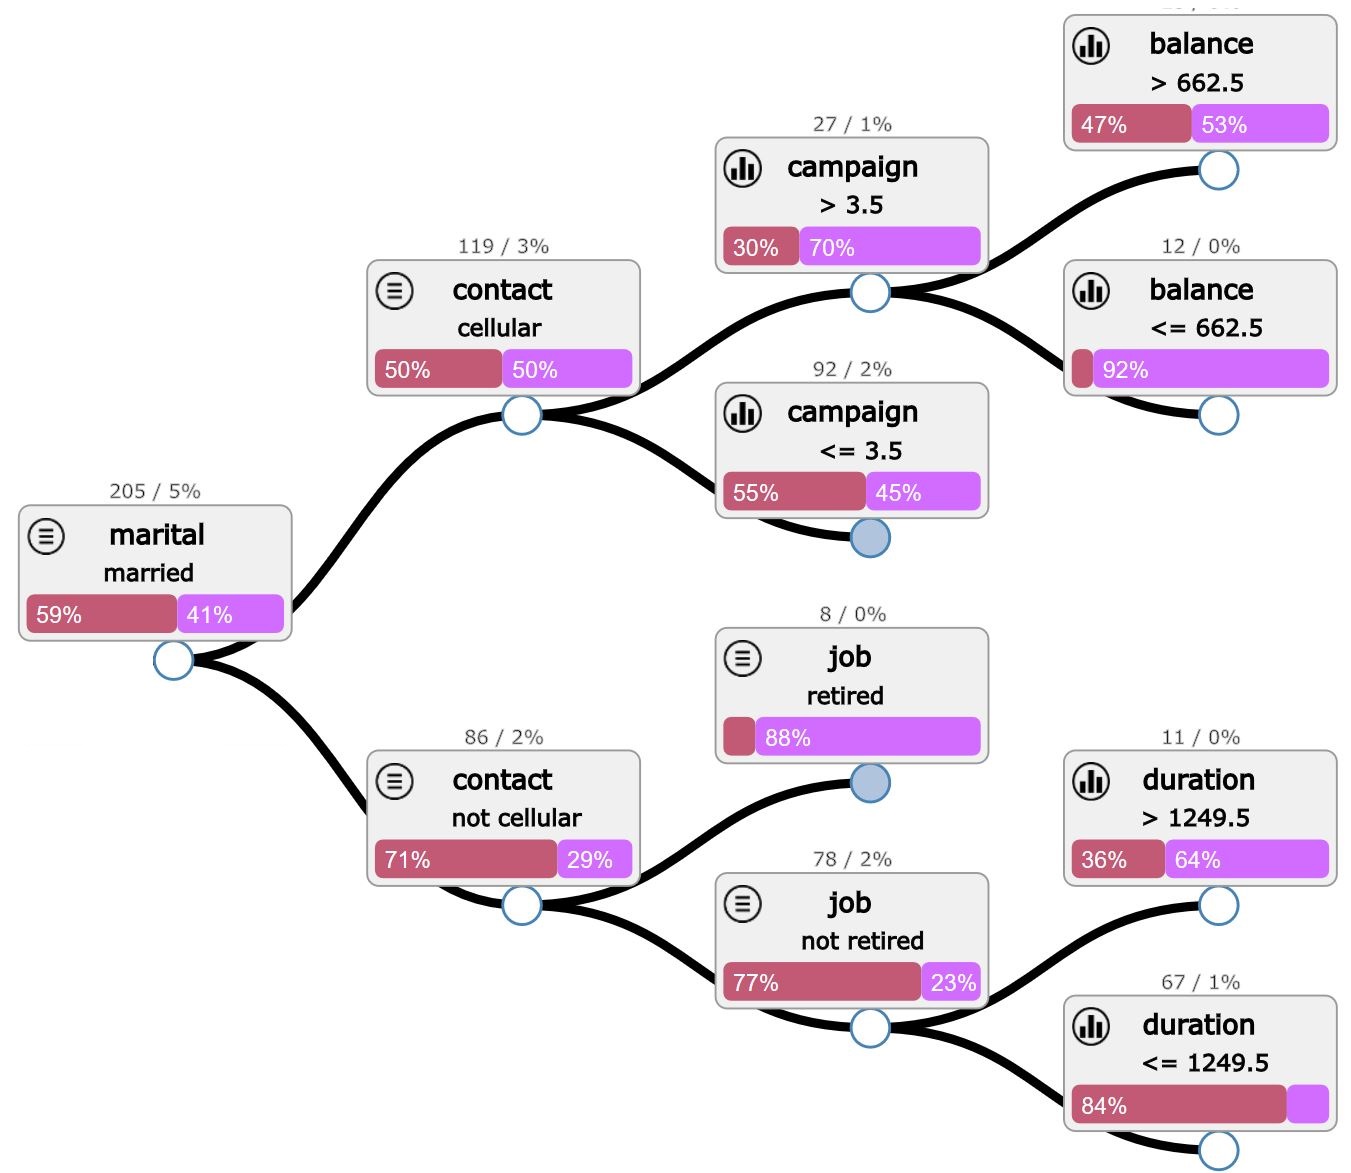
The d3.js visualization proposed here aims at facilitating and improving the readability of the tree, which is based on the implementation of the sklearn library decision tree in python.
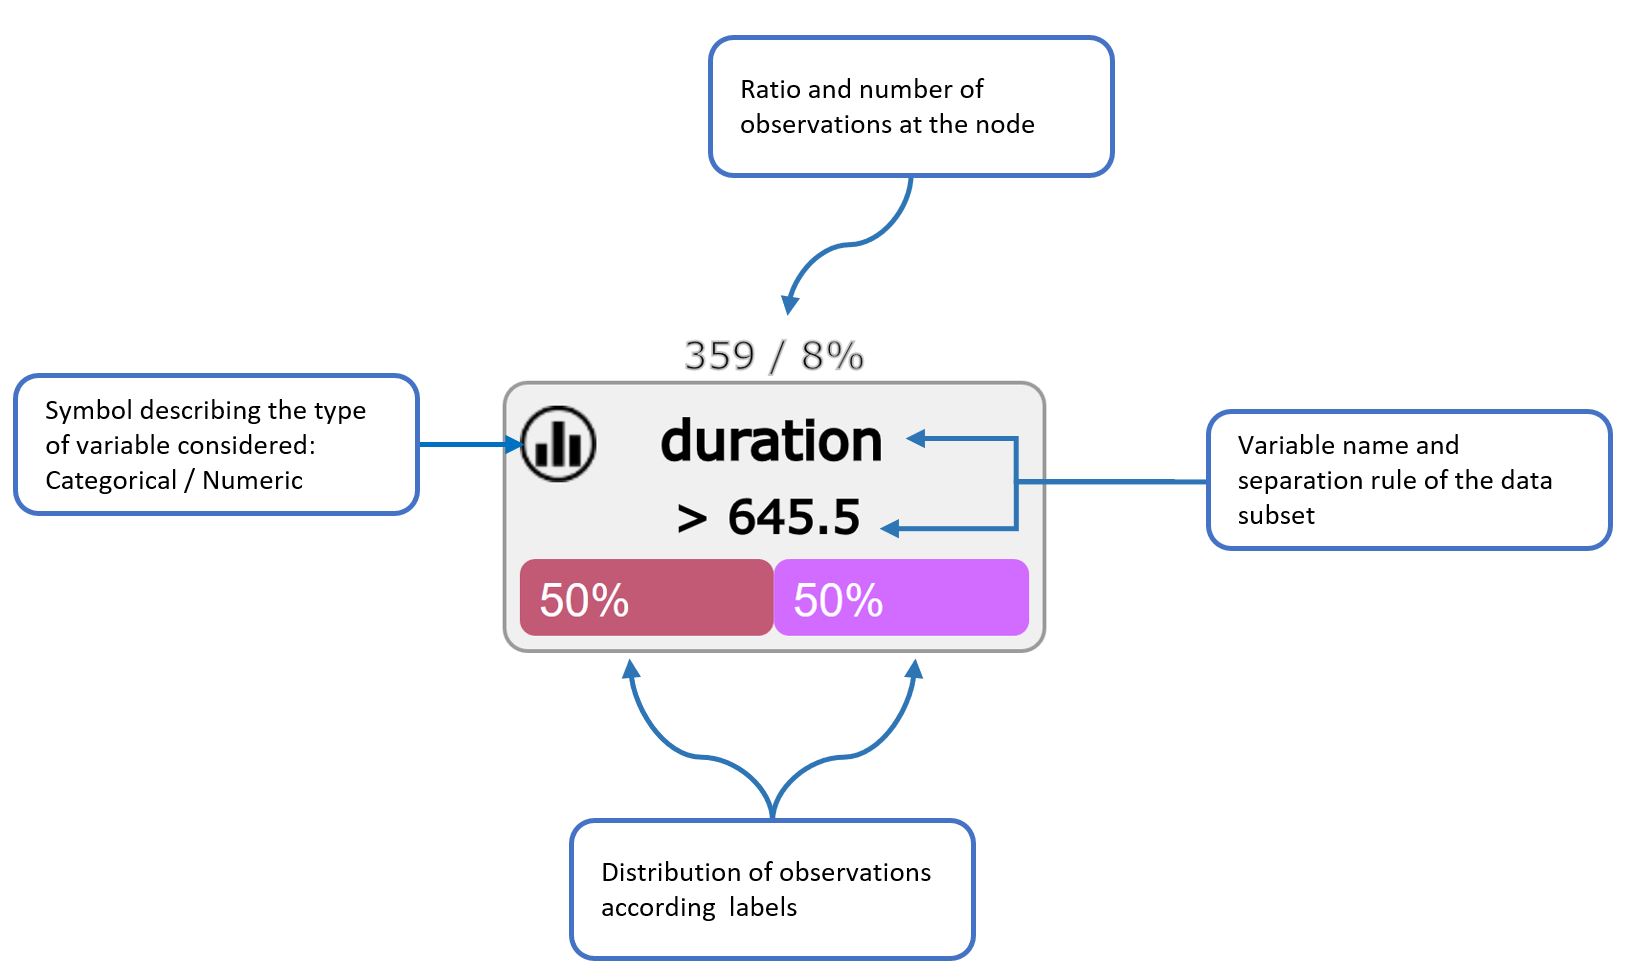
On each node of the tree is applied a calculation operation that leads to a division of the data set. On all of these nodes, a number of features and information can be collected.
They are presented as follows:
The python script takes as input a csv file, which takes care of a first cleaning by deleting the lines with missing values, or by transforming the variables of the categorical type (one-hot-encoding). The implementation of the decision-tree on scikit-learn does not yet take into account this type of variable.
Two json files are output in order to display the tree in two different ways: “StructureC1.json”, “StructureC2.json”. These two files as well as the (optional) parameters must be specified in the index.html file.
Use Firefox to see code d3.js easily, in case of difficulty report you here
The interactive vision is available here and the complete code can be downloaded here
Conclusion
While the race for performance is in full swing, the explanability of the results of the algorithms tends to suffer. The underlying logic of using the data remains mostly difficult to understand.
Decision trees obviously have limitations, but have considerable qualities for a first approach.
it is strongly advised to complete this approach with feature importance, in order to reinforce the understanding of the mechanism of prediction.
References
[1] Huang, Jin, Jingjing Lu, and Charles X. Ling. “Comparing naive Bayes, decision trees, and SVM with AUC and accuracy.” Third IEEE International Conference on Data Mining. IEEE, 2003 [link]
[2] Kumar, Pardeep, Vivek Kumar Sehgal, and Durg Singh Chauhan. “A benchmark to select data mining based classification algorithms for business intelligence and decision support systems.” arXiv preprint arXiv:1210.3139 (2012) [link]
[3] P. Prettenhofer, Decision Tree Viewer (D3 and Sklearn) (2012) [link]
[4] A. Schumacher, See sklearn trees with D3 (2015 [link]